

How a 700-Store Retail Chain Replaced Guesswork with Geographic Intelligence
A custom GIS location intelligence platform unified fragmented market data, cut site selection cycles by 25%, and gave planning teams a shared view of where to grow next.
The Situation
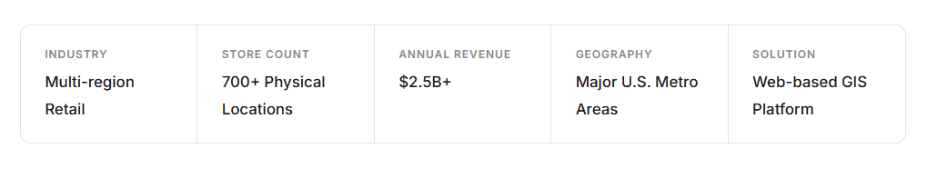
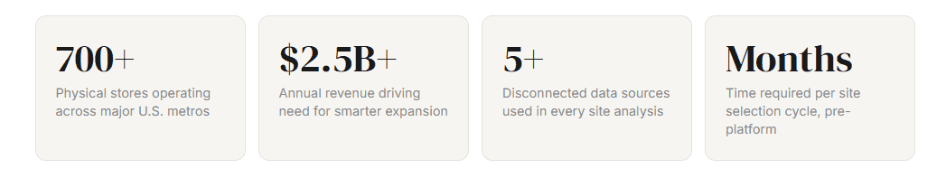
Retail expansion at this scale is rarely a clean process. With over 700 stores operating across some of the country's most competitive metropolitan markets, the company had built a strong footprint but the process behind selecting each new location had not kept pace with the organization's growth.
Planning and real estate teams were doing serious analytical work, just without the right infrastructure to support it. Demographic data, traffic counts, competitor locations, income breakdowns, and mobility patterns all existed as separate spreadsheets, often pulled from different sources, formatted differently and updated on different schedules.
The core frustration was not the data itself. The company had access to meaningful market intelligence. The gap was in how that information could be explored especially when geography was the primary variable driving every expansion decision.
What Was Getting in the Way
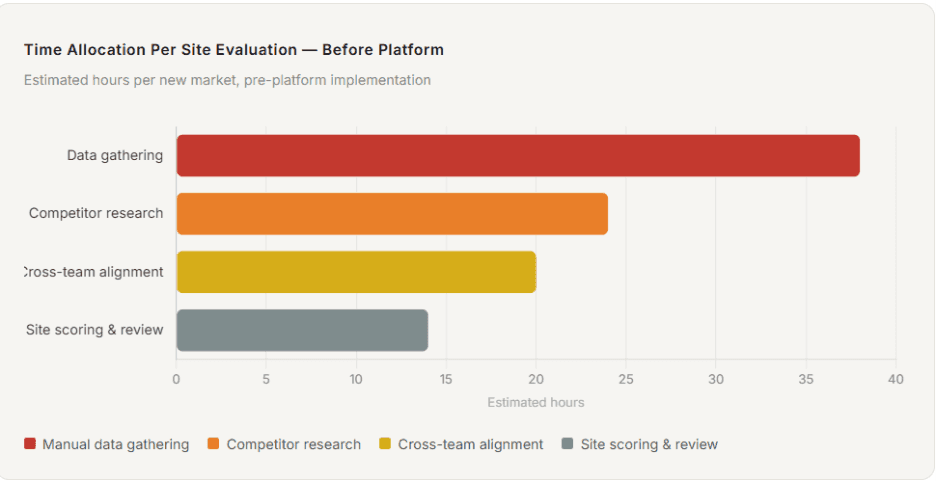
Without a spatial lens on the data, identifying where a new store might genuinely perform well required analysts to manually correlate information across multiple files and draw conclusions from static outputs.
| Challenge area | Before the platform | Impact on the business |
|---|---|---|
| Site analysis workflow | Spreadsheets across multiple departments, manually cross-referenced | Weeks of setup time per analysis cycle; inconsistent outputs |
| Geographic visualization | No spatial view of data; locations plotted manually on static maps | High-potential corridors were invisible to the planning team |
| Competitor intelligence | Rival store locations looked up individually and manually mapped | Proximity analysis took days; often incomplete or outdated |
| Cross-team collaboration | Real estate, marketing, and ops worked from different datasets | Misaligned decisions and repeated rework before sign-off |
| Decision confidence | Expansion decisions made under significant data uncertainty | Longer approval timelines; higher risk of underperforming sites |
Building a Shared Intelligence Layer
12th Wonder developed a custom web-based GIS location intelligence platform purpose-built for the company's expansion planning process. The goal was not to automate decisions, but to give planning teams a far richer, faster, and more collaborative way to evaluate markets.
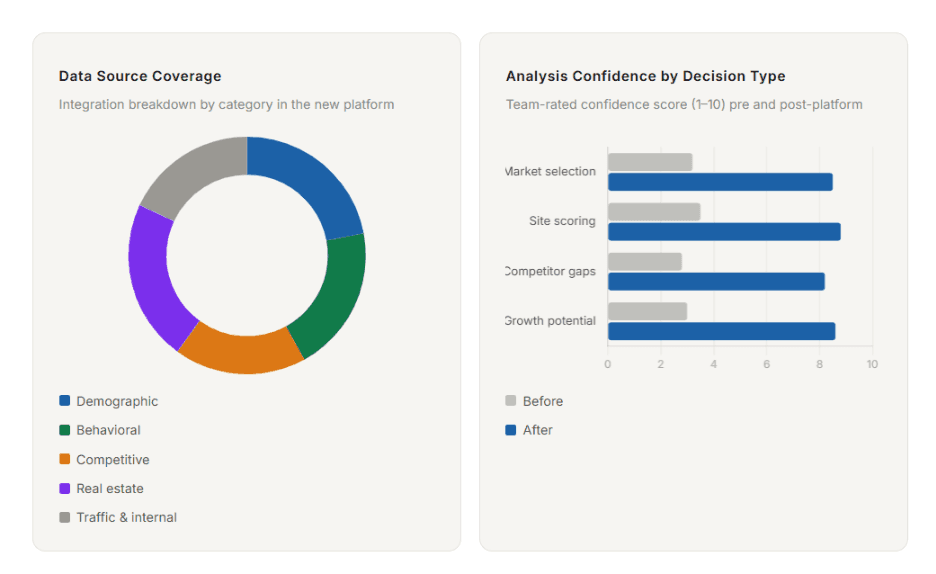
The platform pulled together data sources that had previously lived in separate systems. Spatial analytics sat at the center of the platform's functionality, teams could run site suitability models that scored potential locations based on configurable criteria, adjusting variables and seeing results update in real time.
| Data source | Type | Application in the platform | Update frequency |
|---|---|---|---|
| U.S. Census & ACS | Demographic | Population density, income levels, household composition per market | Annual |
| Consumer mobility data | Behavioral | Foot traffic patterns, dwell times, catchment area modeling | Weekly |
| Competitor store locations | Competitive | Proximity scoring, saturation analysis, gap identification | Monthly |
| Real estate listings | Market | Available sites, lease terms, square footage, co-tenancy mapping | Continuous |
| Traffic count data | Accessibility | Vehicular and pedestrian volume near candidate sites | Quarterly |
| Existing store performance | Internal | Revenue correlation with local demographics for predictive modeling | Monthly |
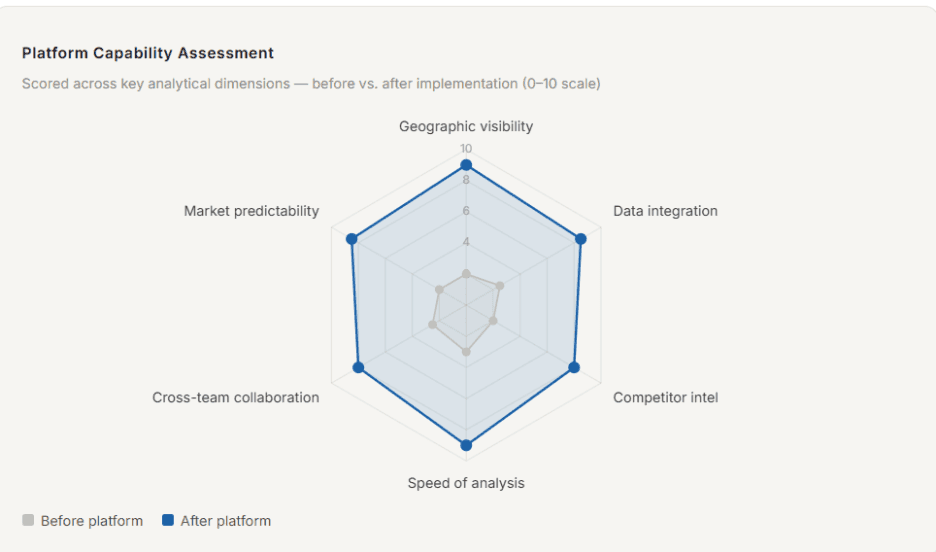
Interactive dashboards enabled executives and planners to explore geographic data through heatmaps, demand clusters, and spatial analysis layers, giving the entire organization a shared view of where opportunity existed and where it didn't.
What Changed After Launch
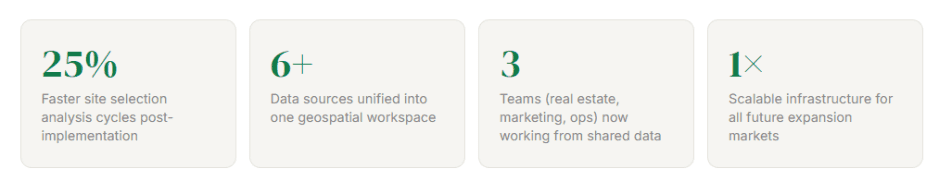
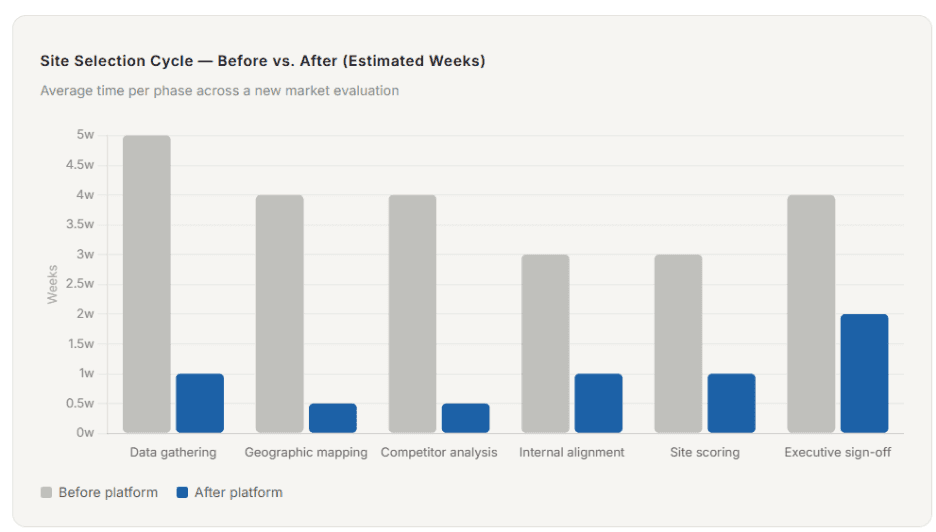
The impact on the site selection process was measurable and practical. Analysis cycles became 25% faster, meaning the team could evaluate more markets in any given planning period without adding headcount or extending timelines.
More meaningfully, the quality of the decisions improved. By surfacing locations with stronger demographic alignment and lower competitive saturation, the platform helped the company move toward higher-growth opportunities it may have overlooked through conventional analysis.
| Outcome area | Before platform | After platform | Change |
|---|---|---|---|
| Site evaluation speed | Months per cycle | Weeks per cycle | 25% faster |
| Data sources in analysis | Fragmented (5+ silos) | Unified (1 platform) | Full consolidation |
| Geographic visualization | Static / manual maps | Live heatmaps & layers | Real-time spatial view |
| Competitor proximity analysis | Days of manual lookup | Instant spatial query | Eliminated manual step |
| Cross-department alignment | Siloed datasets per team | Shared geographic view | Single source of truth |
| Scalability for new markets | Rebuilt for each market | Configurable at scale | Long-term framework |
A More Grounded Approach to Growth
Retail expansion will always involve some degree of judgment. Markets are complex, consumer behavior shifts and no analytical model eliminates uncertainty entirely. What a well-built location intelligence platform does is reduce the noise significantly, so the judgment calls a planning team makes are grounded in better information and reached in a fraction of the time.
For this retailer, the shift from fragmented spreadsheet analysis to a unified GIS environment did not just speed up the expansion process. It changed the quality of the questions the team could ask, and that has a compounding effect on every site decision that follows.