
How a $10B Global Logistics Company Cut Route Planning Time by 30% and Fuel Costs by 18% Through Geospatial Intelligence
A centralized GIS data integration platform unified fragmented logistics data across continents, eliminated static route planning, and gave operations teams real-time visibility into thousands of daily shipments across North America and Europe.
The Situation
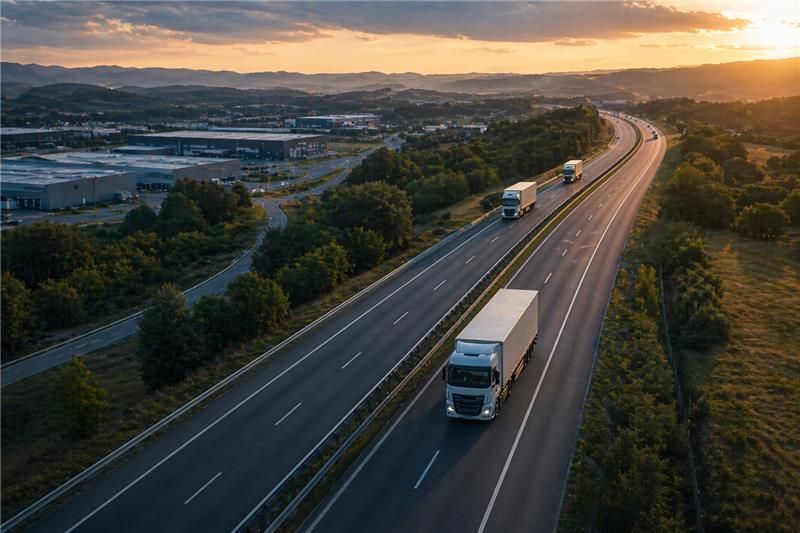
Moving goods at scale is an exercise in orchestrated complexity. With annual revenue exceeding $10 billion and operations spanning North America and Europe, this global logistics provider coordinates thousands of daily shipments through a vast network of distribution centers, transportation fleets, and last-mile delivery services.
The company had built sophisticated systems over decades of growth. Fleet management platforms tracked vehicle locations and maintenance schedules. Warehouse management systems controlled inventory across dozens of distribution centers. Route planning tools calculated delivery sequences. Customer order databases managed incoming requests and delivery confirmations.
Each system worked well within its domain. The problem was that they worked in isolation.
For a company whose entire value proposition depends on moving goods efficiently from point A to point B, the lack of spatial integration across these systems was more than an inconvenience. It was a fundamental constraint on operational performance.
What Was Getting in the Way
The logistics team was doing serious analytical work, but without the infrastructure to make geography the organizing principle of their operations. Route planning relied on static data and manual adjustments by dispatchers who had deep local knowledge but no unified view of real-time conditions across the network.
When a delivery route was planned, it might account for the customer's address and the driver's starting location, but not for current traffic patterns, weather disruptions affecting neighbouring routes, or the optimal consolidation of nearby deliveries that were sitting in different systems.
The Challenge Landscape
| Challenge Area | Before Integration | Impact on Operations |
|---|---|---|
| Data fragmentation | 12+ disconnected systems across fleet, warehouse, routing and orders | Route planners manually correlated data; no unified operational view |
| Route optimization | Static routes planned from historical data, adjusted manually | Inefficient delivery sequences; excess fuel consumption; late deliveries |
| Real-time visibility | GPS tracking isolated in fleet system; no integration with delivery schedules | Unable to dynamically adjust routes when delays occurred |
| Cross-system coordination | Fleet availability, warehouse inventory, and customer orders managed separately | Dispatch decisions made with incomplete information |
| Fuel efficiency | Route planning didn't integrate live traffic, weather, or vehicle load optimization | 15-20% higher fuel costs than theoretically achievable routes |
| Customer communication | Delivery windows estimated from static schedules, not actual vehicle location | High volume of "where is my delivery" calls; customer dissatisfaction |
The gap wasn't data availability. The company had GPS feeds, traffic APIs, weather data, delivery history, and vehicle specifications. What they lacked was a system that brought these data sources together geographically so operations teams could see the whole picture and make better decisions.
Building a Unified Logistics Intelligence Platform
The solution was built around a simple principle: if logistics is fundamentally about moving things through space, then spatial data should be the foundation of every operational decision.
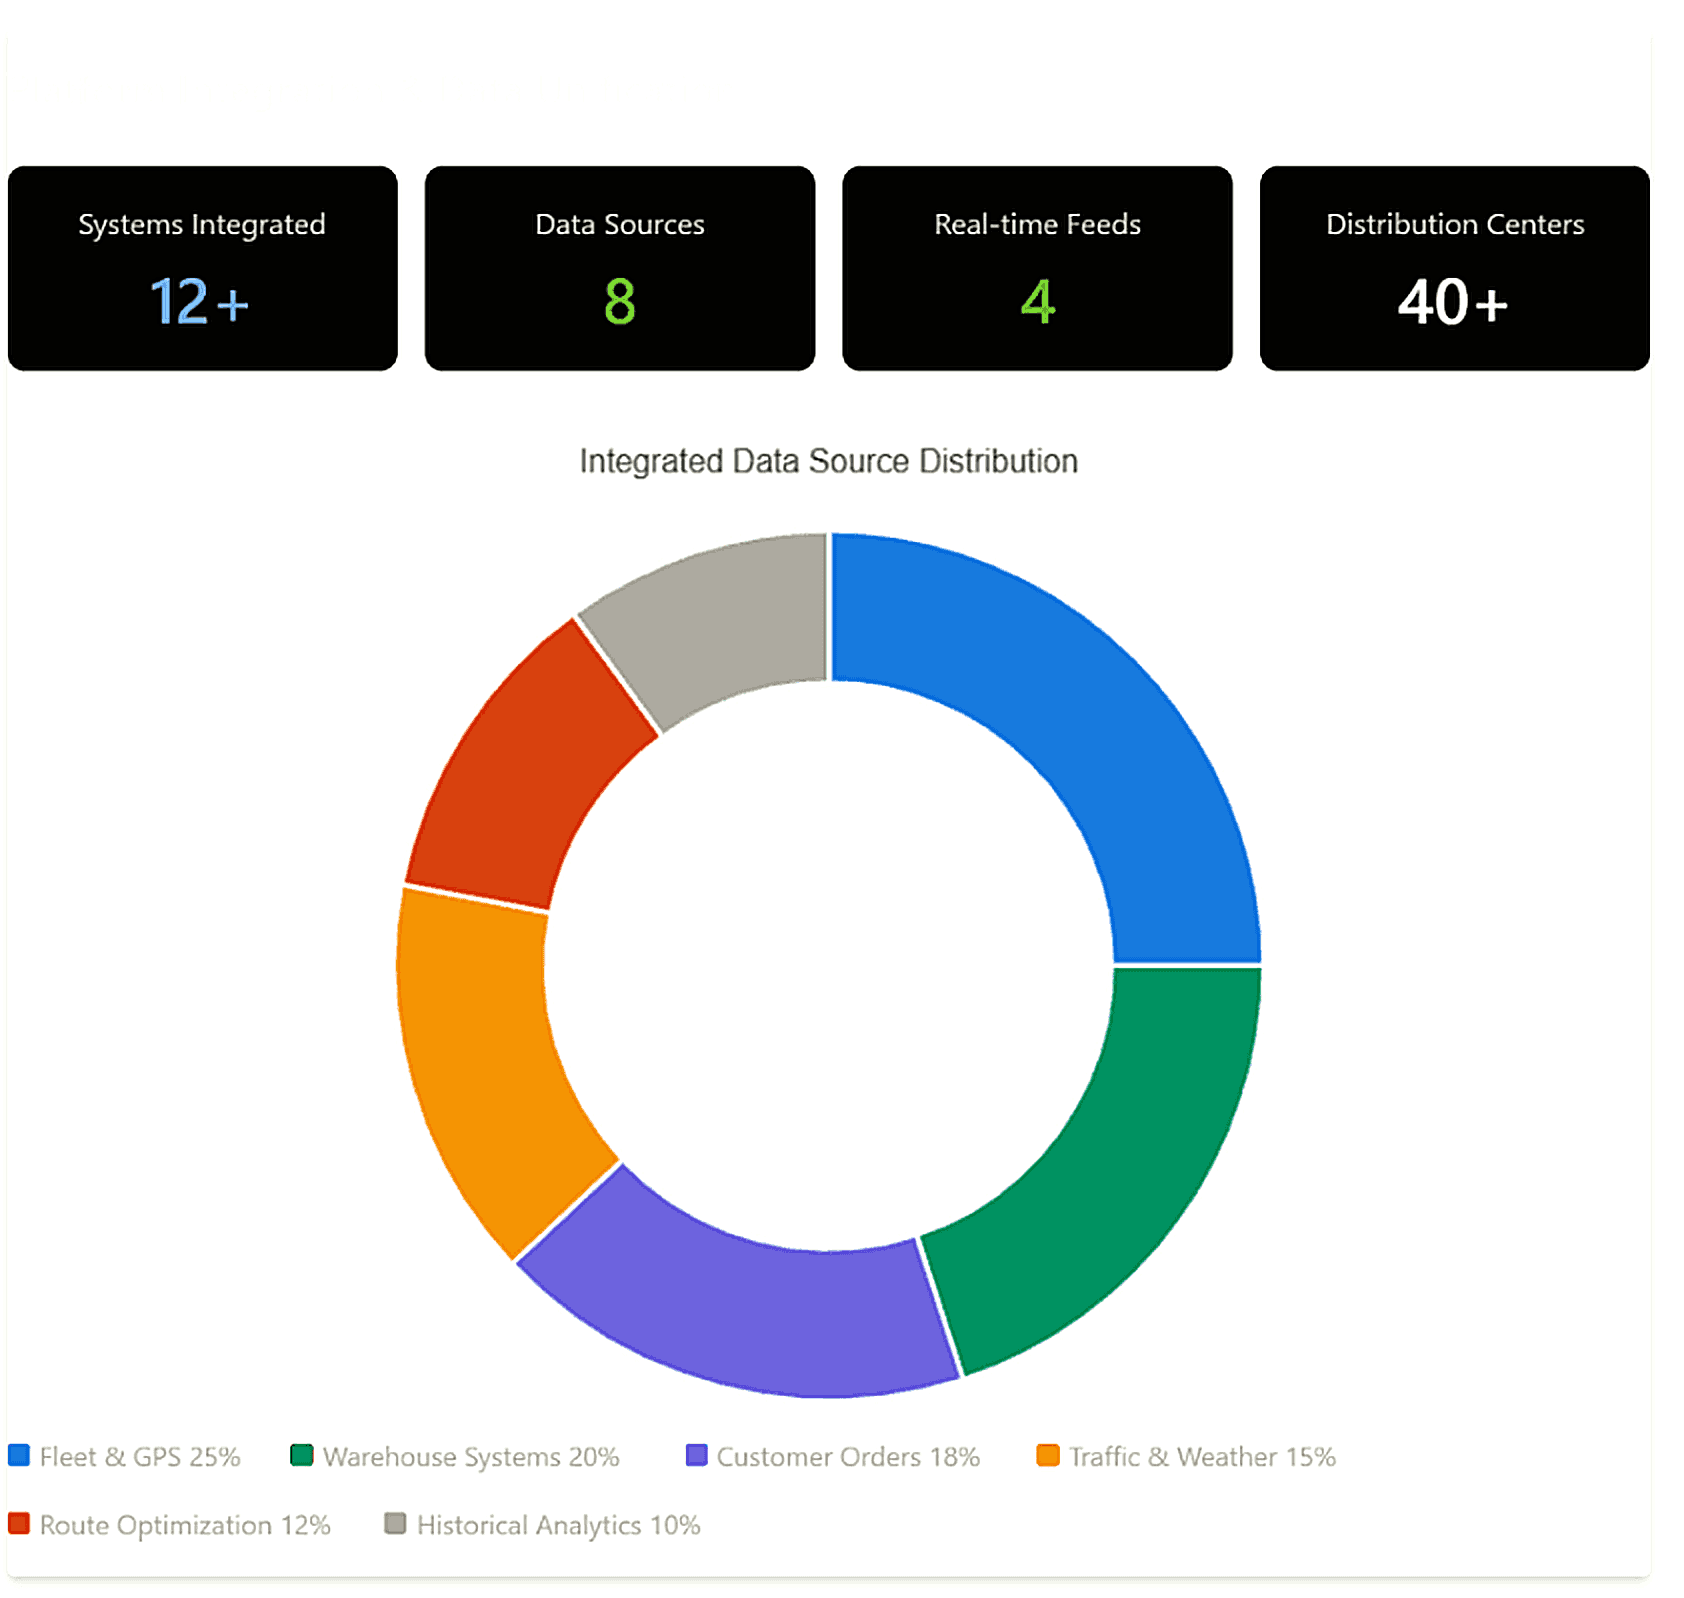
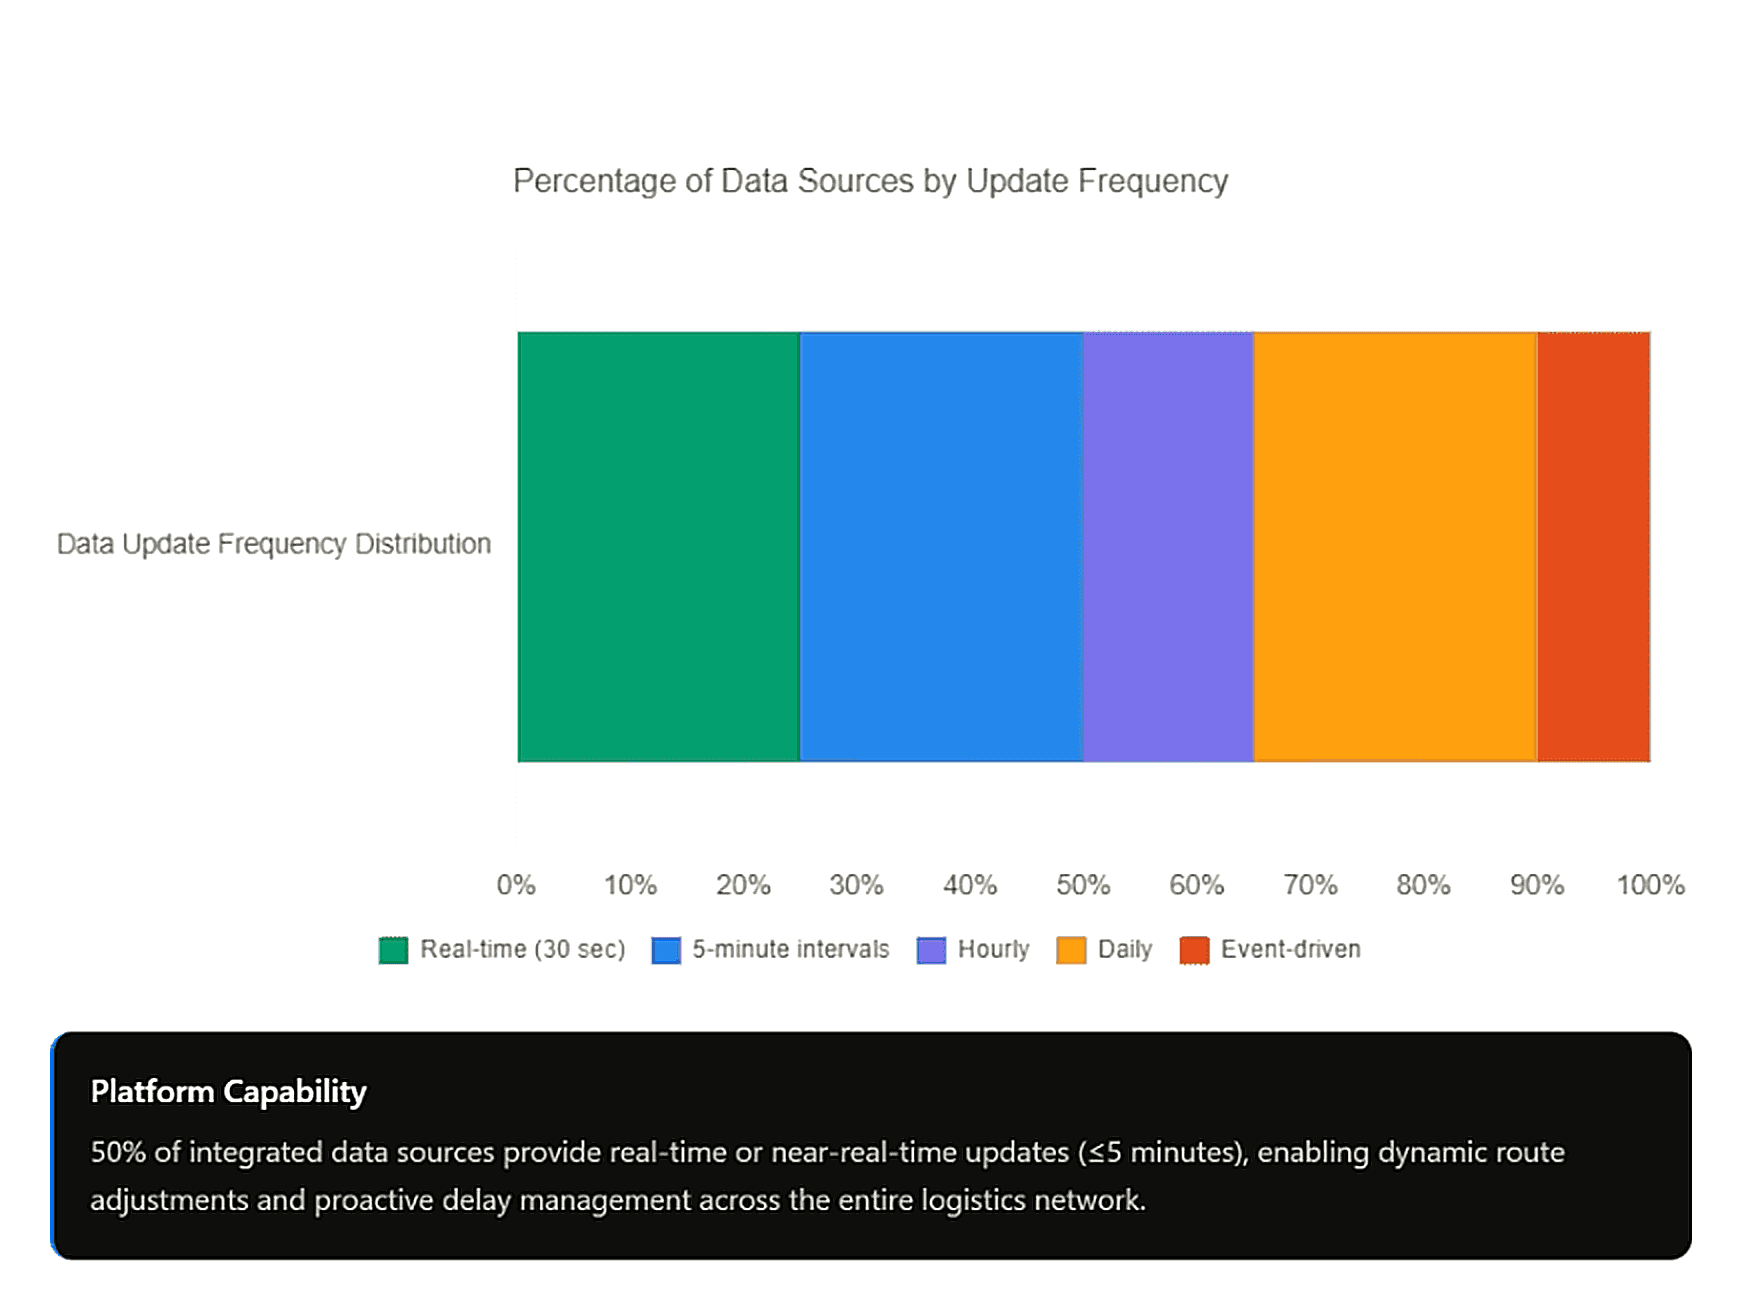
The GIS data integration platform pulled together data sources that had previously operated in separate silos. Real-time GPS tracking from fleet vehicles, warehouse inventory levels, customer delivery windows, traffic condition feeds, weather forecasts, and historical delivery performance all flowed into a centralized geospatial environment.
API-based data pipelines ensured continuous synchronization. When a driver completed a delivery, that event updated the fleet system, the warehouse system, and the route optimization system simultaneously. When traffic congestion was detected on a planned route, the system could immediately identify which deliveries would be affected and suggest alternative sequences.
Integrated Data Architecture
| Data Source | Type | Application in Platform | Update Frequency |
|---|---|---|---|
| GPS fleet tracking | Real-time location | Live vehicle positions, route adherence monitoring, ETA calculations | 30-second intervals |
| Warehouse management | Operational | Inventory levels, order staging, dock availability across 40+ centres | Real-time (event-driven) |
| Traffic condition APIs | External | Real-time congestion data, incident alerts, speed by road segment | 5-minute intervals |
| Weather services | External | Current conditions, forecasts, severe weather alerts by zone | Hourly |
| Customer orders | Transactional | Delivery addresses, time windows, special requirements, priority | Real-time (event-driven) |
| Historical delivery | Internal | Actual vs. planned times, route efficiency scores, customer feedback | Daily aggregation |
| Vehicle specifications | Fleet | Capacity, fuel type, maintenance status, driver assignments | Daily |
| Route optimization | Analytics | Multi-stop sequencing with traffic and time-window constraints | Continuous recalculation |
Interactive dashboards gave operations teams a spatial view of the entire logistics network. Dispatchers could see all active deliveries on a map, identify clusters of orders that could be consolidated, and adjust routes dynamically when conditions changed. Managers could identify systematic bottlenecks by visualizing delivery performance across geographic regions.
Advanced spatial analytics enabled capabilities that were impossible in the fragmented system: predictive ETAs that accounted for current traffic, optimal depot-to-route assignments that minimized deadhead miles, and automated detection of delivery zones with consistently poor performance metrics.
What Changed After Launch
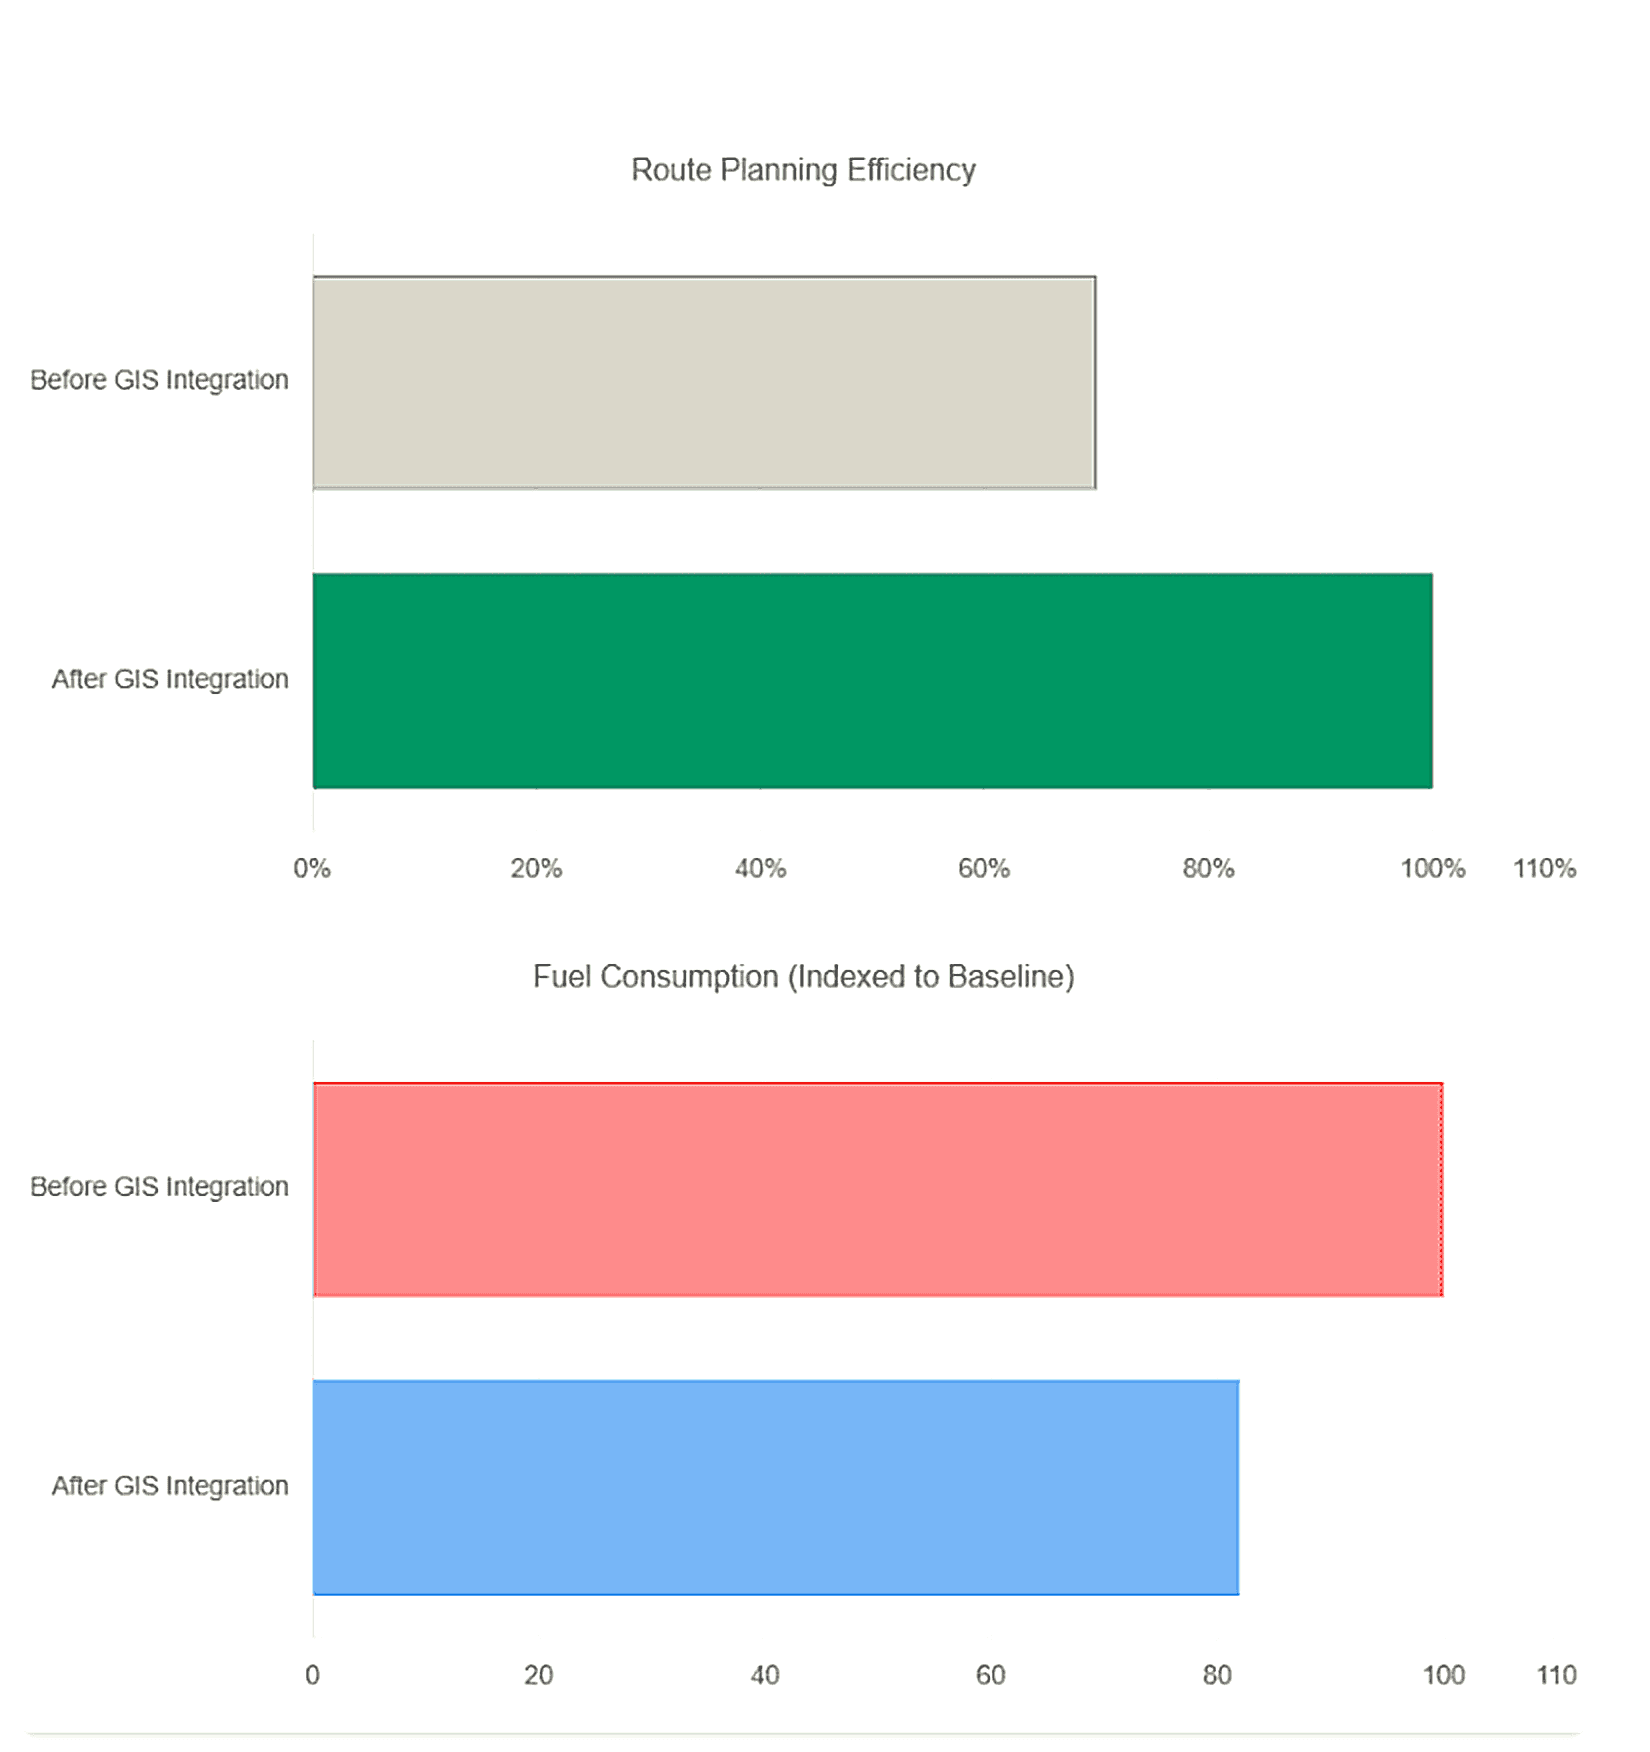
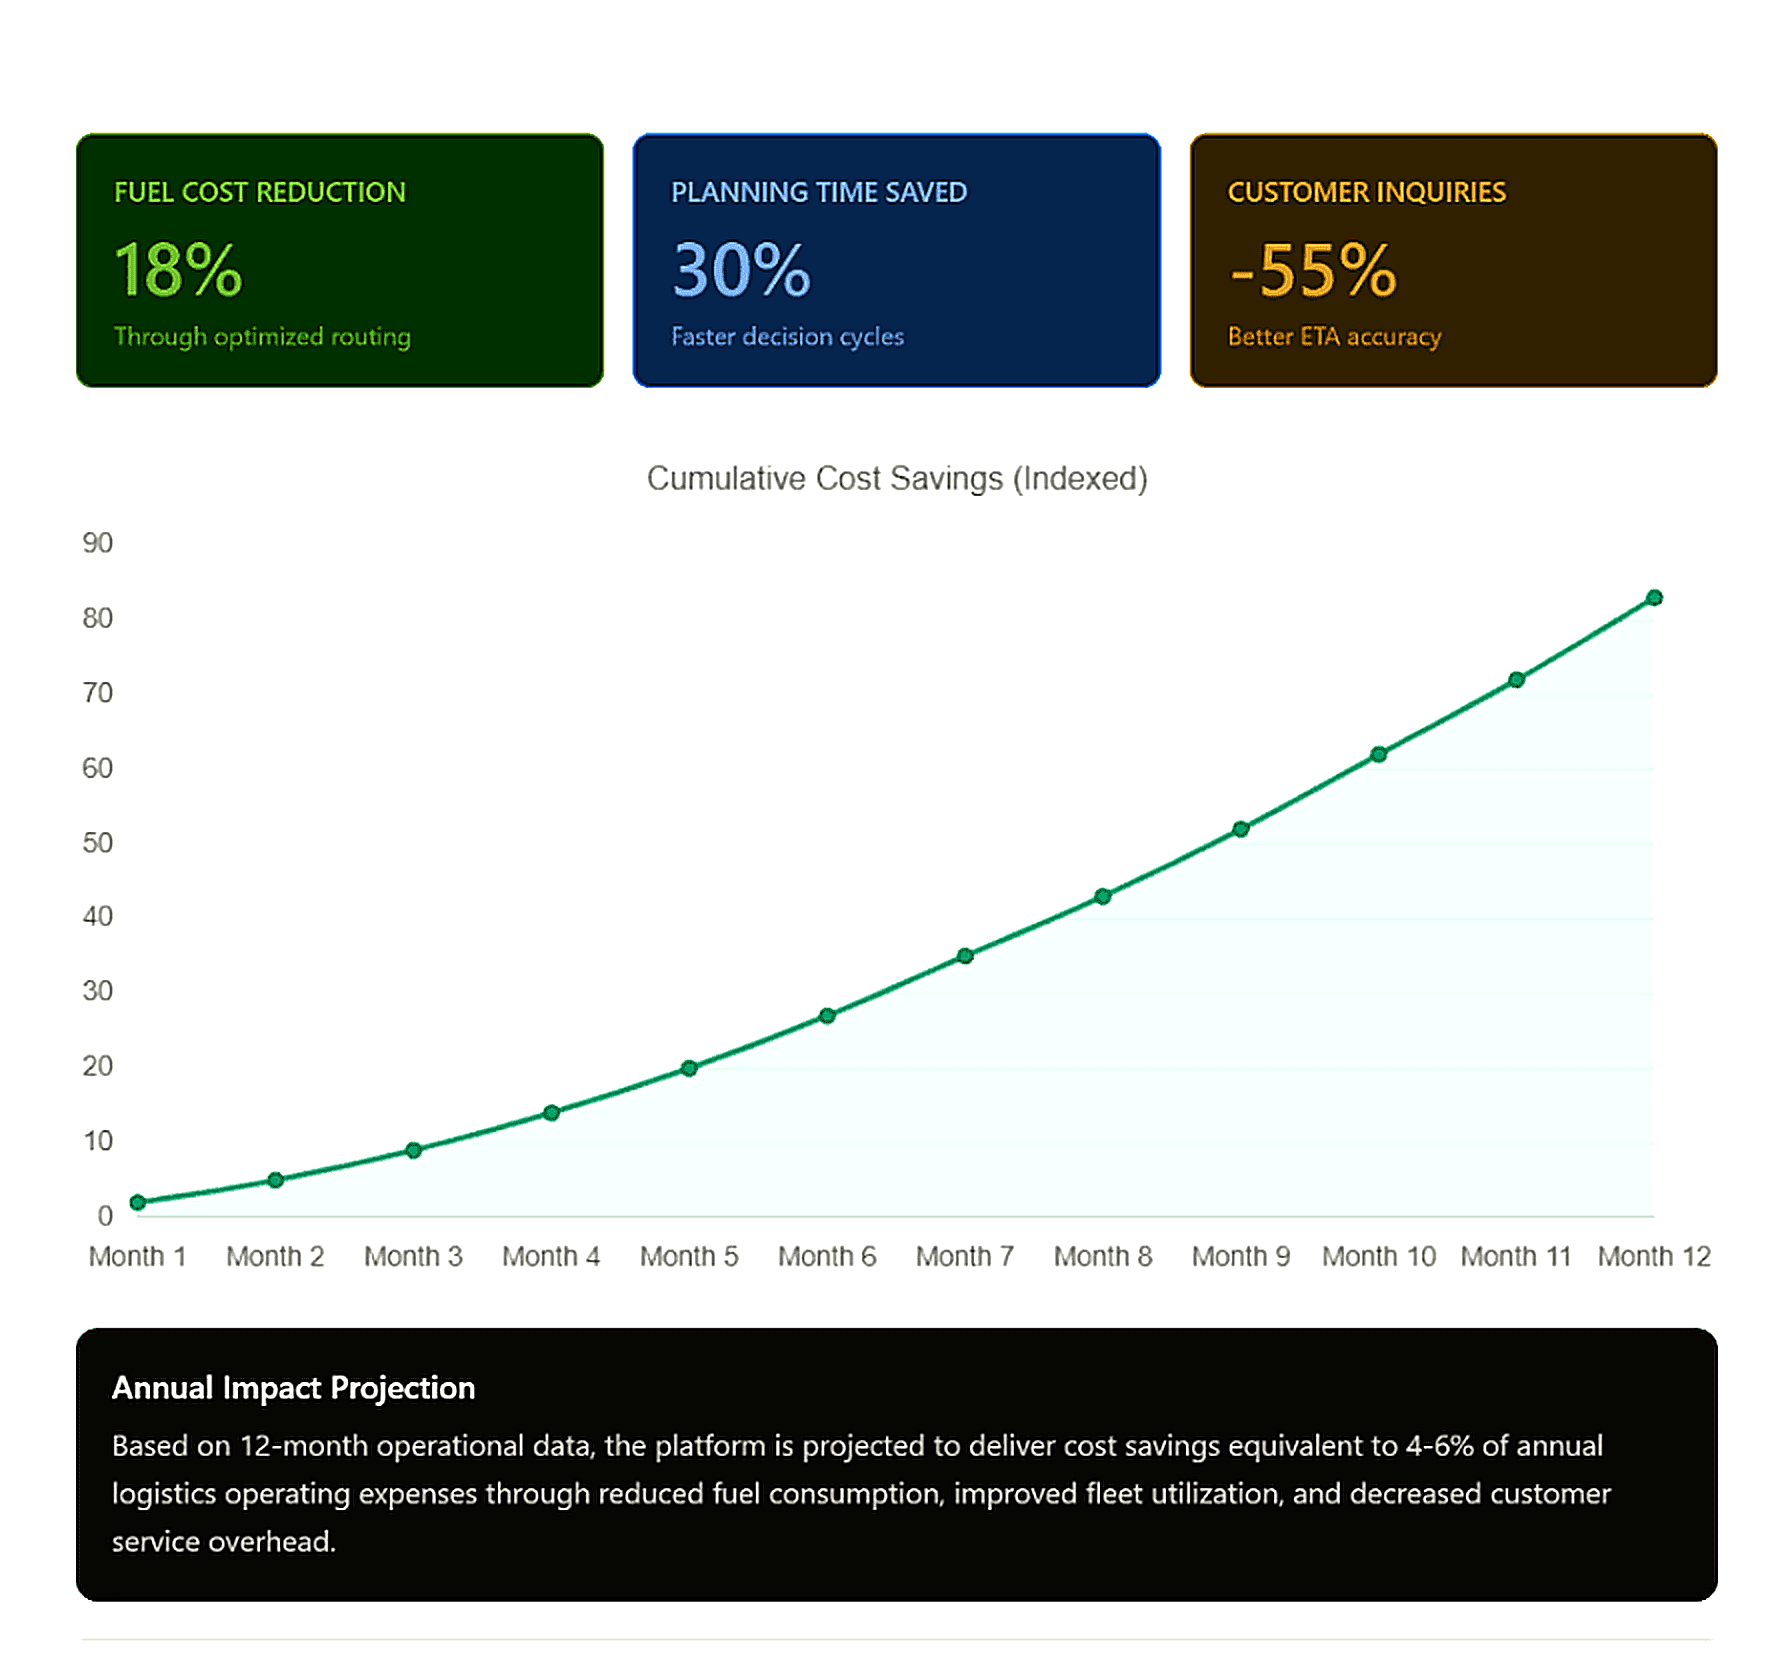
The impact was both immediate and measurable. Route optimization improved by 30%, meaning the same number of drivers could complete more deliveries in less time with fewer miles driven. Fuel consumption dropped 18% as routes were continuously adjusted to avoid congestion and minimize unnecessary travel.
But the operational transformation went beyond efficiency metrics. The platform gave logistics teams the ability to respond to disruptions in real-time rather than discovering problems only when deliveries were late. When weather closed a highway, dispatchers could instantly see which routes were affected and reroute vehicles before delays cascaded through the network.
Customer service improved as delivery time estimates shifted from broad windows based on historical averages to precise ETAs calculated from actual vehicle positions and current traffic conditions.
Measurable Business Impact
Comprehensive Outcomes
| Outcome Area | Before Platform | After Platform | Change |
|---|---|---|---|
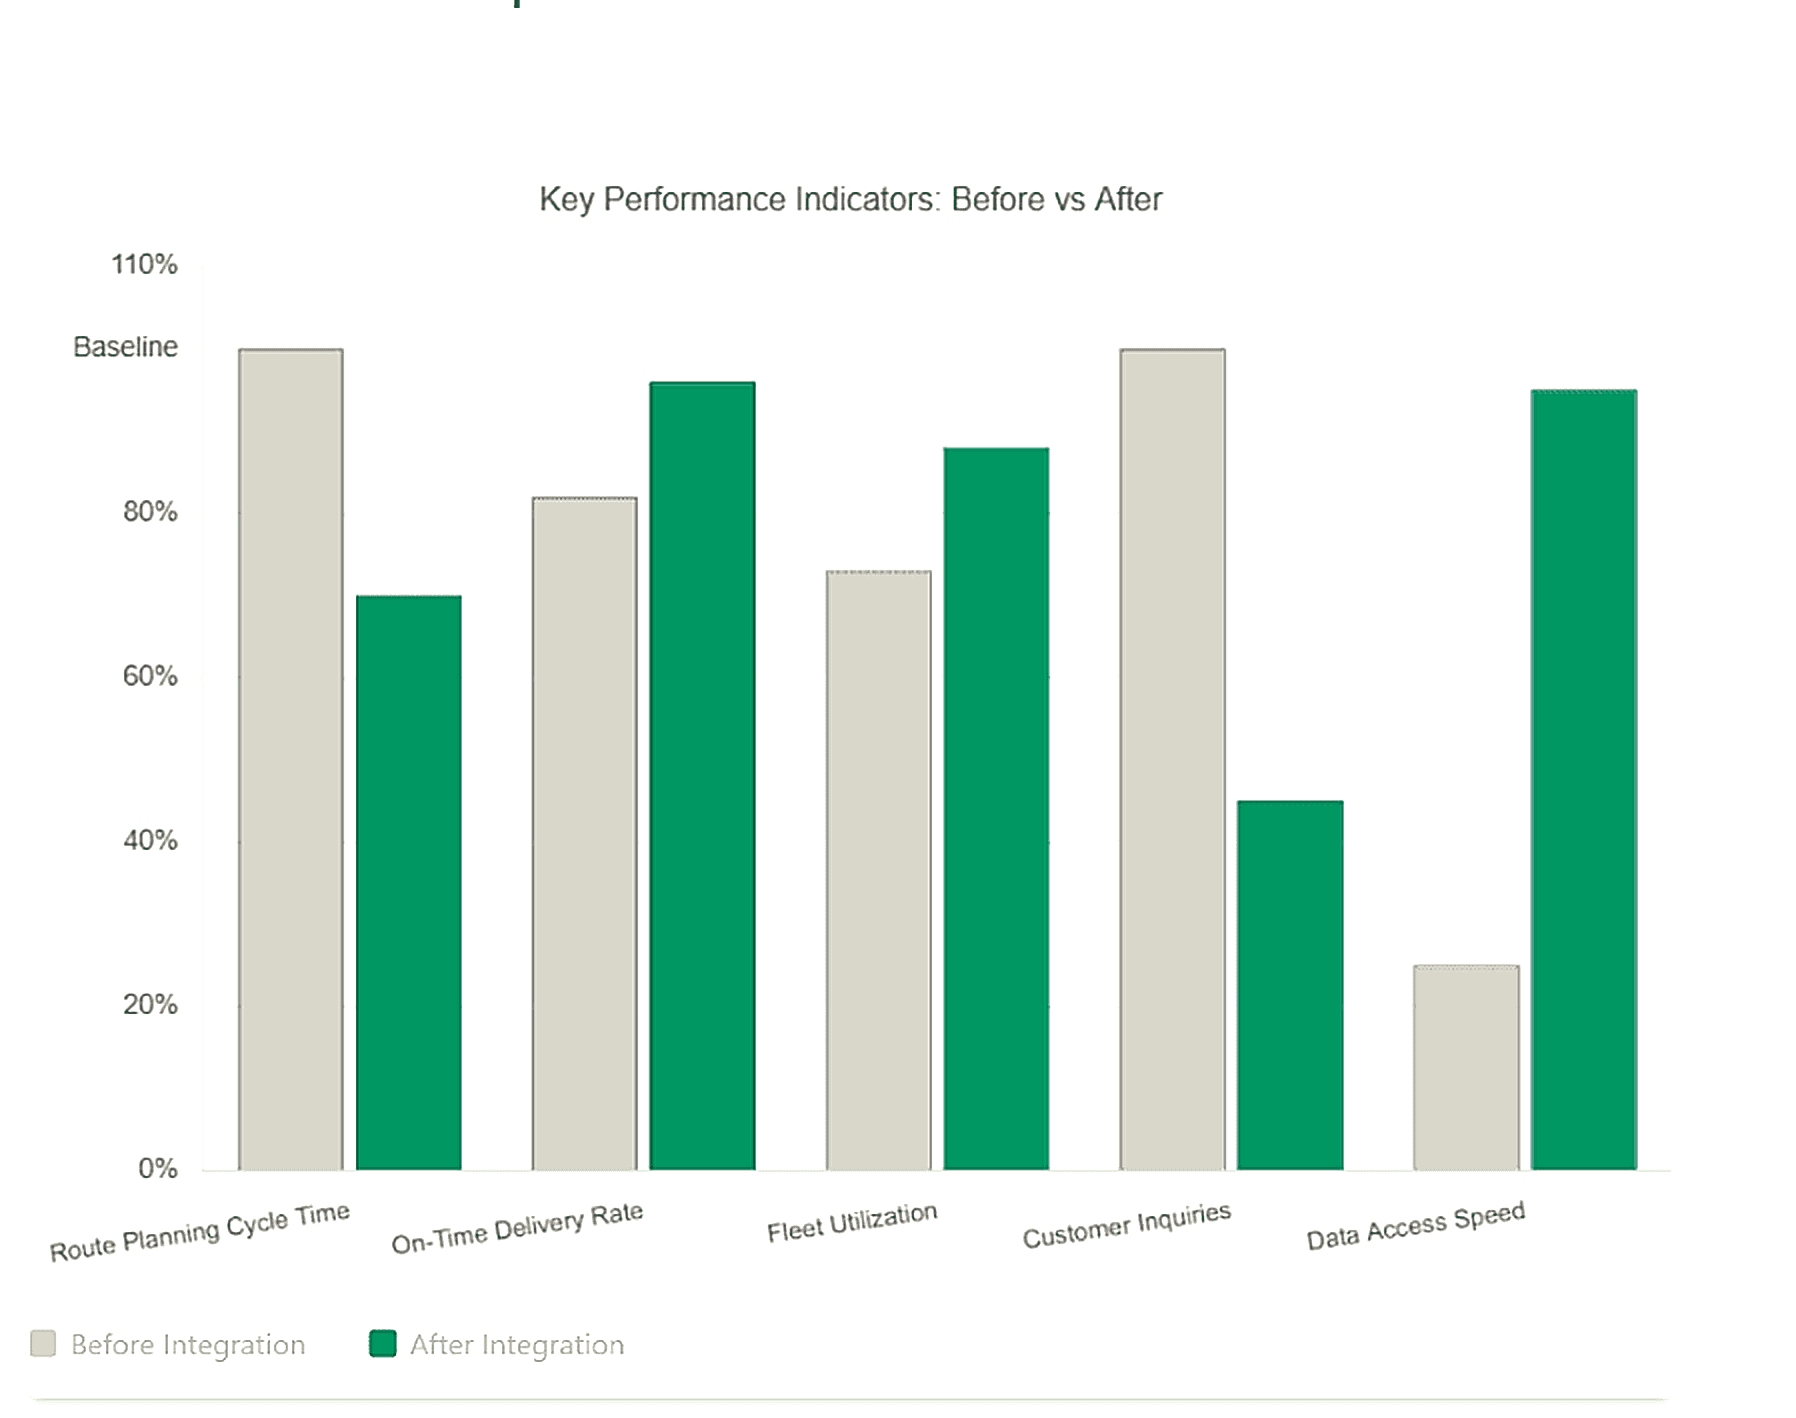
| Route planning speed | 4-6 hours per planning cycle | 1-2 hours per planning cycle | 30% faster |
| Data accessibility | Fragmented across 12+ systems | Unified geospatial platform | Full consolidation |
| Fleet utilization | 73% average | 88% average | 15-point improvement |
| Fuel efficiency | Baseline consumption | 18% reduction per delivery | $millions annual savings |
| On-time delivery rate | 82% within promised window | 96% within promised window | 14-point improvement |
| ETA accuracy | ±45 minutes variance | ±12 minutes variance | 73% more accurate |
| Customer inquiries | High volume of status calls | 55% reduction | Proactive communication |
| Failed deliveries | 8.5% requiring second attempt | 2.8% requiring second attempt | 67% reduction |
Customer Experience Transformation
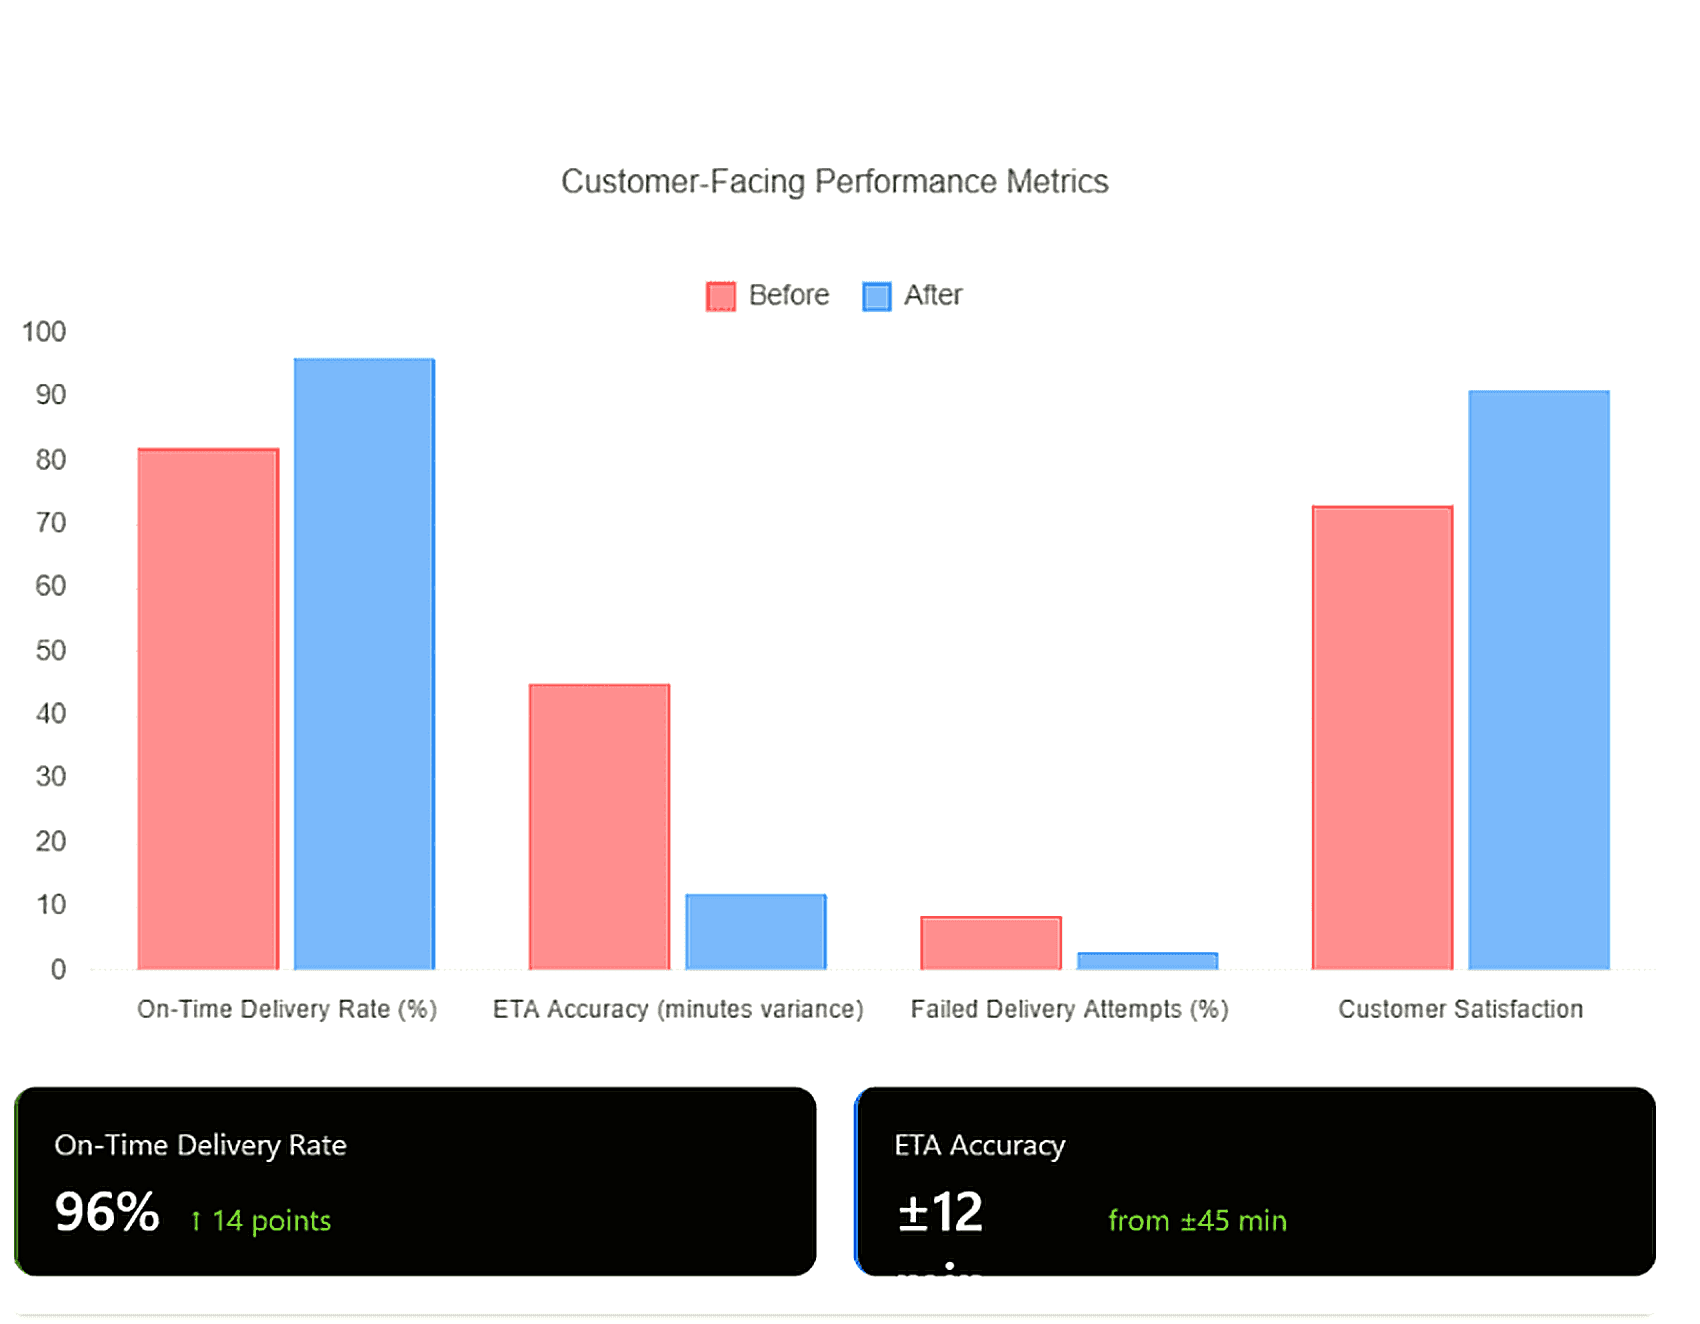
The platform's impact extended directly to customer satisfaction. On-time delivery rates improved from 82% to 96%, while ETA accuracy improved dramatically from ±45 minutes to ±12 minutes average variance. Failed delivery attempts dropped by 67%, and customer inquiries about delivery status decreased by 55% as proactive notifications replaced reactive customer service.
Spatial Analytics Capabilities Unlocked
| Analysis Type | Business Application | Frequency of Use |
|---|---|---|
| Dynamic route optimization | Continuous recalculation based on traffic, weather, and time constraints | Every delivery cycle |
| Delivery zone performance | Identify geographic patterns in late deliveries and service issues | Weekly review |
| Fleet positioning | Optimal vehicle deployment based on demand forecast and current locations | Daily planning |
| Multi-stop consolidation | Automatic detection of nearby deliveries that can share routes | Real-time suggestion |
| Traffic impact modeling | Predict delays from known congestion and suggest alternative routes | Continuous monitoring |
| Depot assignment | Match orders to closest distribution center considering capacity and efficiency | Every order batch |
| Customer density mapping | Visualize delivery concentration to identify underserved areas | Monthly strategic review |
| Predictive ETA calculation | Real-time arrival estimates accounting for position, traffic, remaining stops | Per-delivery tracking |
A More Intelligent Approach to Logistics
Logistics at global scale will always involve complexity that no system can eliminate. Roads get blocked. Weather disrupts schedules. Customers change delivery instructions at the last minute. The difference between an efficient logistics network and an inefficient one is not whether these disruptions happen, but how quickly operations teams can detect them and respond.
For this $10 billion logistics company, the shift from fragmented systems to unified geospatial intelligence changed the fundamental operating model. Route planning moved from a static exercise done at the beginning of the day to a continuous optimization process that adapts as conditions change. Dispatchers went from making decisions with partial information to having real-time visibility into the entire network.
The platform continues to evolve. New data sources are integrated as they become available. Machine learning models trained on historical delivery performance now suggest optimal depot assignments for new customer accounts. The spatial analytics that initially focused on cost reduction are now being used to support strategic decisions about where to open new distribution centers and which geographic markets to prioritize for expansion.
This is what supply chain digital transformation looks like when executed with spatial thinking at its core: not a collection of disconnected tools, but a unified intelligence layer that makes logistics operations visible, measurable, and continuously optimizable.
Key Takeaways
30% faster route planning through unified geospatial data integration across 12+ previously siloed systems
18% fuel cost reduction via continuous route optimization based on real-time traffic, weather, and operational constraints
96% on-time delivery rate enabled by predictive ETAs and dynamic route adjustments when conditions change
55% reduction in customer service inquiries as proactive notifications replaced reactive "where is my delivery" calls
Real-time operational visibility across thousands of daily shipments spanning North America and Europe